
Hey there! Ever feel like you’re pouring your heart and soul into your marketing funnels, but not seeing the results you crave? You’re not alone. Optimizing funnels is a constant battle, but what if I told you there’s a secret weapon that can skyrocket your conversion rates?
Get ready to unlock the power of A/B testing analytics – a game-changer that can transform your funnel performance and leave you feeling like a marketing superhero!
Why Your Funnels Need A/B Testing: The Shocking Truth
Let’s face it, relying on gut feelings to make funnel decisions is like playing darts blindfolded. You might hit the target occasionally, but you’re mostly just hoping for the best. A/B testing takes the guesswork out of the equation, allowing you to make data-driven decisions that will actually move the needle.
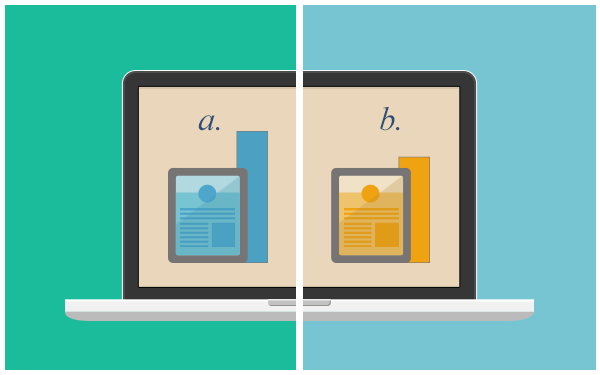
Think of A/B testing as a scientific experiment for your funnels. You’re testing different variations of elements like headlines, images, calls to action, and even entire page layouts to see which performs best. The results? Hard data that tells you exactly what resonates with your audience and drives conversions.
Unmasking the A/B Testing Process: A Simple Guide
Don’t worry, you don’t need a PhD in statistics to run effective A/B tests. It’s actually a pretty straightforward process, and I’m here to break it down for you in a way that’s easy to understand.
Step 1: Identify Your Funnel’s Weak Spots
The first step is to pinpoint the areas of your funnel that are underperforming. This could be a high bounce rate on a landing page, a low click-through rate on a call to action, or a high cart abandonment rate. To identify these weak spots, you can use tools like Google Analytics to analyze your funnel data.
Step 2: Formulate a Hypothesis
Once you’ve identified a problem area, it’s time to come up with a hypothesis about how to improve it. For example, if you’re seeing a high bounce rate on your landing page, your hypothesis might be that changing the headline will make it more engaging and reduce bounces.
Step 3: Create Two Versions
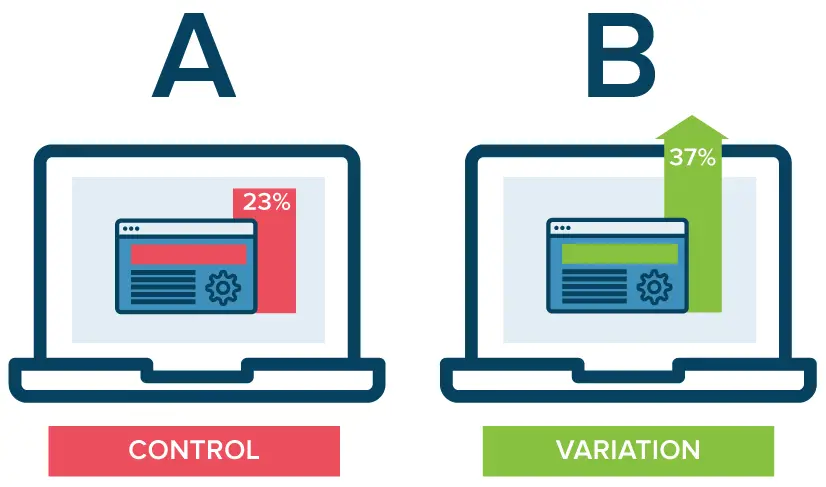
Now it’s time to put your hypothesis to the test! Create two versions of the element you’re testing – the original (your control) and a variation that incorporates your proposed improvement. Remember to only change one element at a time so you can clearly identify what’s driving the results.
Step 4: Let the A/B Testing Begin!
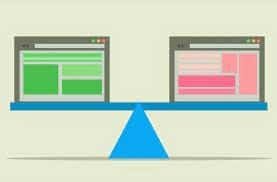
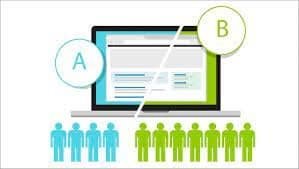
Using an A/B testing tool, you can split your traffic evenly between the control and the variation. This ensures both versions are exposed to a similar audience, providing a fair comparison.
Step 5: Analyze the Data and Declare a Winner
After a predetermined period, your A/B testing tool will gather enough data to determine which version performed better. This is where the magic of analytics comes in – you’ll see metrics like conversion rate, click-through rate, and bounce rate for each version, revealing the clear winner!
Step 6: Implement the Winning Variation
Once you have a clear winner, it’s time to implement the winning variation into your funnel and watch those conversion rates soar!
Decoding the Metrics: A/B Testing Analytics Explained
Now that you understand the process, let’s dive into the juicy part – A/B testing analytics! These metrics will give you the insights you need to make data-driven decisions:
Conversion Rate: The Holy Grail of Metrics
This is the ultimate measure of success – the percentage of visitors who complete your desired action. A higher conversion rate means more leads, more sales, and more happy dance moments!
Click-Through Rate (CTR): Measuring Engagement
CTR tells you how many people are clicking on your call to action, links, or other elements. A high CTR indicates strong engagement and interest from your audience.
Bounce Rate: The Silent Killer
A high bounce rate means people are landing on your page and bouncing right back without taking any action. Yikes! This could indicate a problem with your page’s relevance, design, or user experience.
Time on Page: Gauging User Interest
This metric tracks how long visitors are spending on your page. A longer time on page can suggest engaged users who are consuming your content and considering your offer.
Heatmaps: Visualizing User Behavior
Heatmaps provide a visual representation of how visitors are interacting with your page, showing you where they’re clicking, scrolling, and hovering. This can reveal areas of interest or frustration, providing valuable insights for optimization.
Beyond the Basics: Advanced A/B Testing Strategies
Ready to take your A/B testing game to the next level? Here are some advanced strategies that will blow your mind (and your conversion rates!):
Multivariate Testing: The Juggling Act
Instead of testing one element at a time, multivariate testing allows you to test multiple variations simultaneously. This can speed up the optimization process, but it requires more traffic and a deeper understanding of statistics.
Personalization: Tailoring the Experience
Personalizing your funnel based on user data can significantly improve conversion rates. This might involve showing different content or offers based on demographics, interests, or past behavior.
Behavioral Targeting: Striking While the Iron is Hot
Behavioral targeting allows you to show different variations to users based on their past actions. For example, you could target users who have abandoned their cart with a special offer to encourage them to complete their purchase.
A/B Testing Tools: Your Secret Weapon
Don’t worry, you don’t have to be a coding wizard to implement these advanced strategies! A/B testing tools make it easy to set up and run tests, analyze the results, and implement the winning variations. Some popular options include:
- Google Optimize: A free and powerful tool that integrates seamlessly with Google Analytics.
- Optimizely: A robust platform with advanced features for enterprise-level testing.
- VWO: Another popular option with a user-friendly interface and a wide range of features.
Conclusion
A/B testing analytics isn’t just a nice-to-have – it’s a must-have for any business serious about optimizing their funnels and maximizing their conversions. By embracing the power of data-driven decisions, you can:
- Increase Conversion Rates: Say goodbye to guesswork and hello to data-backed improvements that will drive more leads and sales.
- Improve User Experience: A/B testing helps you identify and eliminate friction points in your funnel, creating a smoother and more enjoyable experience for your users.
- Boost ROI: By optimizing your funnel, you can get more bang for your marketing buck and improve your overall return on investment.
So, what are you waiting for? It’s time to unleash the power of A/B testing analytics and watch your funnel performance soar!
FAQs
How long should I run an A/B test? The duration of your A/B test will depend on factors like your website traffic and the statistical significance you’re aiming for. As a general rule of thumb, it’s recommended to run tests for at least a week or two to gather enough data for reliable results.
What if my A/B test doesn’t show a significant difference? Don’t fret! Even if your initial test doesn’t produce a clear winner, it’s still valuable data. It means you’ve ruled out one potential improvement and can move on to testing other variations. A/B testing is an iterative process – keep experimenting and refining until you find what works best!
What are some common mistakes to avoid in A/B testing?
- Testing too many elements at once: This can muddy the results and make it difficult to pinpoint what’s driving the changes.
- Not running tests long enough: You need sufficient data for statistically significant results.
- Ignoring statistical significance: Don’t jump to conclusions based on small differences – make sure your results are statistically significant before declaring a winner.
- Not implementing the winning variation: What’s the point of testing if you don’t act on the insights? Make sure to implement the winning variation into your funnel promptly.