

There are few things a marketer can do that will have a greater impact on the performance of their website than setting up Google Analytics and learning how to read it. Whether your website is a small blog or a sprawling multimillion-dollar e-commerce store, the array of insights Google Analytics offers can translate into more informed decision-making that, in turn, can lead to better business outcomes. How do you transition from being completely bewildered by data to becoming a data whiz looking at the same information and assets? This primer will show the way.
Why Google Analytics is a Must-Have Tool
The Data-Driven Advantage
Data is king in the digital age, and Google Analytics allows you to see exactly how your visitors use your website. From the sources of your traffic to how visitors use your site, you can make data-driven decisions.
Tip: Pattern recognition is what Google Analytics is really good for. Nobody reads to find out what Cracked.com seconds-long videos are most likely to be viewed on a mobile phone. Nobody cares. What people do read is the information about use and behaviour patterns. By looking at your visitors, you can design your site and content to better serve them. A good example of this is if you discover a blog article is driving a lot of traffic: maybe there is a popular theme there you can serve up more of.
Setting Up Google Analytics: A Quick Overview
First of all, you have to set up Google Analytics on your website—it’s easy to do, but most important, do it right.
Pro Tip: Go one step further by using tools like Google Tag Manager to implement your code. Google Tag Manager is a free tool that can be used as a container to deploy marketing tags (including Google Analytics) on your site and manage your tags without editing the code itself. This usually makes implementing a script much easier and also helps limit accidental errors that can lead to bad data.
Navigating the Google Analytics Dashboard
Understanding Key Metrics and Dimensions
Once your Google Analytics account is set up, the next step is to become familiar with the Google Analytics dashboard, which houses all your data. At first glance, the dashboard can be overload.
Pro Tip: Just focus on telling apart metrics and dimensions. A metric is a unit of quantitative measurement (for example, sessions, bounce rate, conversion rate), and a dimension (for example, traffic source, location, or device type) is an attribute that provides some level of qualitative metric. This is important because metrics measure ‘what’ is happening, and dimensions describe the ‘why’.
Customizing Your Dashboard for Actionable Insights
You can customise your dashboard to focus on specific metrics that Google Analytics considers ‘key’, which really means ‘important’. You can choose whether those important data themes match your goals.
Advanced Tactic: Create a set of dashboards that shed light on different parts of your business (eg, one dashboard on SEO performance, another on social media traffic, another on e-commerce conversion rates) so that you always know where to look for each topic.
Delving Into Audience Insights
Who Are Your Visitors?
One of the first things you should ask yourself is: ‘Who is going to my website?’ Google Analytics will tell you all about who is visiting, including things such as your audience’s demographics or interests and how they’re interacting with your site.
Audience tip: In addition to setting a broad definition of audience, you can narrow it down to specific sub-components by leveraging your first-party data as part of the remarketing campaign. To approach this successfully, you can go straight to the Audience Overview report, which keeps a tab on your visitors. Explore it further by turning to the first column in your left dashboard, which presents all your prospective visitors across different dimensions. Once you have identified your core audience, you can break it down further by exploiting the high-inference groups such as affinity and in-market as part of the All Categories report (located at the top, in the left dashboard). This helps you identify those individuals most likely to endorse your posts.
New vs. Returning Visitors: What’s the Difference?
Knowing the relative percentage of new versus returning visitors gives you a valuable look at how good you are at keeping people on your site.
And that’s why a good, healthy balance between new visitors and returning visitors is usually a good sign: if you’re getting too many new visitors, you probably aren’t interesting enough to have return visitors; if you’re getting too many of the same visitors over and over, you probably aren’t bringing in new people. Use this for your content strategy—if it so happens that you’re getting a lot of the same users, then try offering a bit more variety to bring in new users, or offer something to make your existing audience keep coming back for more.
Mastering Acquisition Reports
Traffic Sources: Where Are Your Visitors Coming From?
The Acquisition reports from Google Analytics show how visitors are reaching your website—through search engines, social media, direct traffic, or referring links.
More Advanced Strategy: Once you know how much of your traffic comes from certain sources, dive into the Source/Medium report to see traffic by a specific source. For instance, if you want to get more traffic from organic search, the content metrics report might show that you have a lot of inbound traffic to your URLs that start with /blog- but not many to the URLs starting with /services/.
Bottom line: make sure your content ranks highly for a keyword whose traffic matches your targeted demographic. Further dive in the source/medium report to see, for instance, that most of your traffic comes from Google organic traffic. You can then decide whether you want to work on your SEO strategy to attract more users from this channel.
Alternatively, if what you want is more traffic from social media and the Source/Medium report shows that you don’t have much traffic from social networks, then you can figure out what your competitors are doing and try to replicate their strategy. For instance, if your competitors are getting a lot of their traffic from Facebook, you could test paid social ads or an influencer partnership to get more
Tracking Campaign Performance with UTM Parameters
You need to insert UTM parameters in your marketing campaigns if you want to observe how they are doing as far as Google Analytics is concerned.
Now, if you see that 10 conversions came from campaign A and 50 conversions came from campaign B, then you know you’re spending more than you should on B. Other wonderful features can help you analyse more data from your web traffic (though I won’t be covering those here). If you’re not already using Google Analytics, I say go for it! Not familiar with its features? Start by typing ‘Google Analytics Tutorial’ into YouTube’s search box.
A final pro tip: add UTM (unique token of mercy!) parameters to the URLs of your campaigns so you can track which one lands where in the Campaigns report of Google Analytics. UTM parameters are free, on-the-fly ways of creating traces of your marketing efforts. Suppose you paid for a landing page on Us Magazine’s website (which reaches 50 million people weekly) and for Facebook advertising.
You haven’t spent that little money in a long time, but Google Analytics can convert that into a powerful way to sort through your web traffic data and tell you which campaign is working. If 10 conversions were made from campaign A on your website under the Us Magazine promotional page and 50 conversions from campaign B on your Facebook advertising, then you know you’re spending more on B than the B brings back. Tools such as Google’s Campaign URL Builder generate the actual links with UTM parameters for your campaigns.
Unlocking Behavior Insights
What Are Your Visitors Doing on Your Site?
If you visit the Behavior section of Google Analytics, it will reveal how people visit your site, from page to page, and at what point they drop off.
Examine the diagram below for any errors and type your response into the answer box provided. Remember: there will be one inaccuracy, and your spellings should be kept to a minimum.Alcohol consumption levels in the US from 1997 to 2030In the past two decades, people in the US have been drinking more. However, with current recommendations to reduce alcohol intake, it is expected that consumption will decrease significantly in the next 20 years. Per capita sales of beer helped boost sales during the late 1990s, particularly in 1998. Wine sales also increased, but not to the same extent as beer. In 1999, whiskey and spirit sales dropped sharply, but later in 2002, they experienced a significant rise, which lasted until 2007.Thereafter, alcohol sales remained stable, with a steady consumption level.
Nevertheless, in the 2010s, people began to follow government recommendations. Consumers shifted from enjoying a wide variety of alcoholic beverages to focusing on drinking fewer but healthier options. On the other hand, per capita spirits experienced a slight increase in 2020.The figure shows that there were fluctuations in alcohol sales throughout the past 20 years but also a noticeable upward trend. This demonstrates that Americans have increasingly been purchasing and consuming more alcohol since the late 90s.
Site Speed: The Silent Conversion Killer
Site speed is also a leading indicator of user experience, a factor that can affect your conversion rate. Google Analytics can tell you how fast your pages are loading.
Pro Tip: Check the Site Speed report to find pages that take longer to load and optimize them. You can reduce the size of their images, use browser caching, and compress JavaScript files to keep your site fast and make people stay longer, hopefully to the point where they turn into customers.
Conversions: The Ultimate Goal
Setting Up Goals and Funnels
For most websites, conversions are the ultimate objective—sales, leads, sign-ups, etc. Google Analytics lets you track these conversions by what it calls ‘Goals’.
More Sophisticated Strategy: To assist with conversion optimisation, you can chart the Goal Funnel as users make their way towards a conversion. This will allow you to see where people are dropping off in the funnel and optimise those key stages of the journey to increase your conversion rate. If you are noticing a high abandonment rate at the checkout step, you may want to simplify this part of the process or offer additional incentives to finish the purchase, etc.
Ecommerce Tracking: A Game-Changer for Online Stores
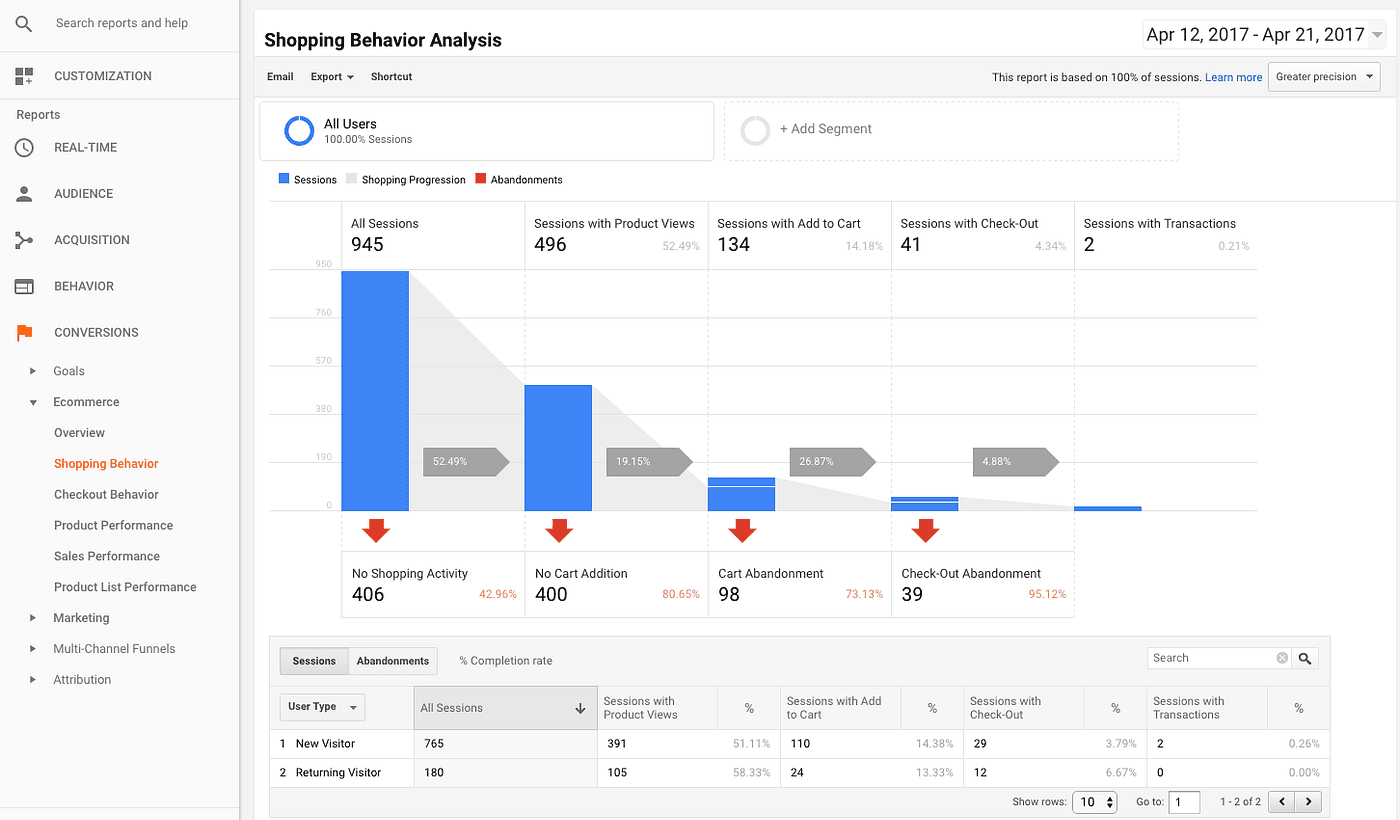
If you run an e-commerce site, then enabling Enhanced Ecommerce in Google Analytics can show you, for example, how far into the buying cycle your online customers go.
Pro tip: The Product Performance report, showing which of your products really create revenue, and the Shopping Behavior report, showing how users move through the purchase funnel, are pretty useful here; use them to inform everything from how you price your products to what you promote to customers.
Leveraging Advanced Features
Custom Reports: Tailoring Data to Your Needs
The above chart excluded a number of the metrics and dimensions that Google Analytics can track—to remedy that, report creation is a very powerful feature of Google Analytics. By setting up custom reports, an analytics user can focus on the metrics and dimensions that they care about.
Third-Level Strategy: Regardless of what standard reports record, advanced strategy involves creating custom reports that track desired goals Assume you want to enhance user behavior and benchmark a segment of new users against other users under the same circumstances. You’d design custom reports that incorporated measures of session duration, pages per session and bounce rate across segments of new users.
Real-Time Reporting: Immediate Insights
Using the Real-Time reports in Google Analytics, you can monitor activity on your site as it occurs—something that can be helpful if you want to see the effects of a marketing campaign in real time, for example, or need to detect and fix an issue immediately.
Pro Tip: Use real-time reporting to track spikes in traffic that might occur on the site, such as those related to a product launch, a flash sale or other events. This helps you respond to problems with server load or broken links more quickly.
Data-Driven Decision Making: The Next Steps
Regular Reporting and Analysis
After all, if a report is filed, read and understood, but no decisions are made based on the insights gleaned from Google Analytics, what good has it served? The key is regular reporting and analysis. It’s only through continual analysis that you’re able to make those key business decisions that breathe new life into an organisation.
Bonus Tip: By setting up regular automatic reports into your inbox, you’ll make sure you keep an eye able to understand trends and issues as they occur. You can also schedule more focused sessions periodically in order to do a deeper data dive and discover further opportunities for optimisation.
Integrating Google Analytics with Other Tools
Data has its greatest value when it ‘bolts’ to other tools in your marketing stack, such as uploading it to Google Ads to drive retargeting, carrying over conversion data to Search Console to show you keywords leading to purchases, or sharing name and email data with your CRM platform for eventual use in sending messages to past customers.
Pro tip: integrations help to paint a more complete picture of your marketing activity, allowing you to join the dots with other marketing tools and data sources you already have. For example, connecting Google Ads and Google Analytics will show you how well your paid campaign is performing within the analytics platform, for example, clicks-to-conversion and traffic from your ads. Similarly, you can connect to Google Search Console to monitor how well your site is doing in terms of search engine optimisation (SEO) activity, such as the keywords ranked, rankings, and click-through rates (CTR) in one place.
Intermediate Strategy: Use Google Data Studio to pull all of your data from multiple sources and merge it into one report. The tool can pull data from platforms including Google Analytics and others, which would enable you to create reports that are visually appealing, shareable, and easy to update. You’ll be able to see your key performance indicators (KPIs) in one holistic report.
Google Analytics for SEO: Unleashing Its Full Potential
Keyword Analysis and SEO Performance
It is hard to imagine a better tool for helping you keep track of your SEO than Google Analytics. It might surprise you to learn that Google Analytics doesn’t offer any direct keyword data. Thanks to certain privacy limitations, Google only shares information about which domains or websites have your keywords in their URLs, as these are public in the Google cache. Sure, you can add link tracking software to your site and analyse people as they arrive via a referral link from a search results page, but only if they aren’t using private browsing software. Despite all of this, it’s important to note that there are great things you can do with Google Analytics in conjunction with Google Search Console.
Bonus insider tip: Acquisition > Search Console > queries report will reveal which keywords you currently rank (and drive traffic) for and what type of content these searchers encounter when they land on your site. You can track how your content performs in organic search and which pages you should optimise even further. Pay attention to the Landing Pages report, which will show you how your own SEO-optimised pages perform and which need optimisation.
Identifying and Fixing SEO Issues
With Google Analytics, you can also begin improving your SEO performance if, for example, your site’s Google rankings are falling because of a failed overseas data centre.
Geeky Strategy: Use an Advanced Segment from the Behavior > Site Content > Landing Pages report to observe the bounce rate and average session duration for your key landing pages. A high bounce rate might be due to a page with content not relevant to the user’s intent, or the content might be slow to load—i.e., Google is surfacing results that aren’t relevant or isn’t serving pages due to slow load times. Cross-reference this information with the Crawl errors in Google Search Console’s Coverage report to see if there is a logic issue—e.g., if it’s cached content that is irrelevant—or a technical issue that can be resolved by fixing the indexing of your site.

Enhancing User Experience (UX) with Google Analytics
Analyzing User Behavior for UX Improvements
As human activity is the basis for your web site, a good user experience (UX) is key to both keeping visitors around your site and transforming them into customers, and Google Analytics provides plenty of tools that support your UX analysis and optimisation effort.
Insider Tip: The Behavior Flow report is a great way to get started with your UX analysis. It tracks a user journey from one page or event to another. It represented your user’s experience journey on a website. If needed, you can create and save a customized flow report and reuse it. It can help you identify the shortcomings in the user experience, and you can test several changes and find out what works best.
Let’s say you have a 50% drop-off on the second most significant page of your website. It indicates that the overall user experience is not performing as expected. You would find where you went wrong and make significant changes in your design, content, or usability, and test them to see if the drop in traffic has improved your flow.
Using Heatmaps for Deeper Insights
Although statistics data will give you lots and lots of numbers, tools such as Crazy Egg or Hotjar can overlay heatmaps, giving you qualitative data about what users are reading, as well as where they’re clicking, how far they scroll, and which elements receive the most attention.
Pro Tip: Pair these heatmap tools with Google Analytics for a comprehensive understanding of visitor behaviour. For instance, if Google Analytics displays a high bounce rate on a specific page, a heat map might show that users are not able to see the CTA as it is below the fold. Armed with this information, you can modify the page layout to improve the visibility and engagement.
Staying Ahead with the Latest Features and Updates
Leveraging Google Analytics 4 (GA4)
Google Analytics 4 (GA4) is the next generation of Google’s analytics platform, offering better insights with easy-to-use features and functionalities. GA4 is becoming an event-based tracking system and making it easily involved in the tracking system of different devices.
Hack: If you’re not already doing this, go and create a new property in GA4 alongside your existing Universal Analytics property, so that you can start gathering data into GA4 but still have access to everything you’re used to seeing in Universal Analytics—and eventually, GA4 will take over and that historical data will be really useful. Also, start exploring GA4’s enhanced tracking, including automating your event tracking and letting AI report what it sees as relevant to you. This is a great way of finding things that may be outside of your regular thinking and could become big trends and opportunities.
Keeping Up with Updates and Best Practices
This is especially important because Google Analytics is constantly being upgraded; new features and enhancements are added as a matter of course.
ADVANCED STRATEGY: Keeping tabs on the latest Google Analytics updates and best practices is as simple as subscribing to Google’s official Analytics Blog or signing up to receive updates from other industry sites such as Search Engine Journal or Moz to be informed about the latest updates. You might also want to join online communities or forums (e.g., Google Analytics forum) so that you could trade ideas with other analytics professionals. That way, you’ll be among the first to leverage the latest tools and features of Google Analytics to optimise your site’s performance.
Conclusion
You can now use Google Analytics for good, which is more powerful than you think. It’s just a tool, like an IT guy or a hammer, but it’s extremely powerful when harnessed correctly and with intention. Knowing its ins and outs and employing its advanced strategies will set you on a path towards turning data into actionable knowledge.
Whether you want to understand where your traffic is coming from, how many conversions to value to expect, or how to best optimise your site for SEO, all the data you could ever need to make these decisions is available in Google Analytics each and every day. Once you get more comfortable with it, you will find new ways to use it, from building customised reports to integrating with the rest of your tech stack.